

When Headlines Meet Earnings
The market finally has something new to think about.

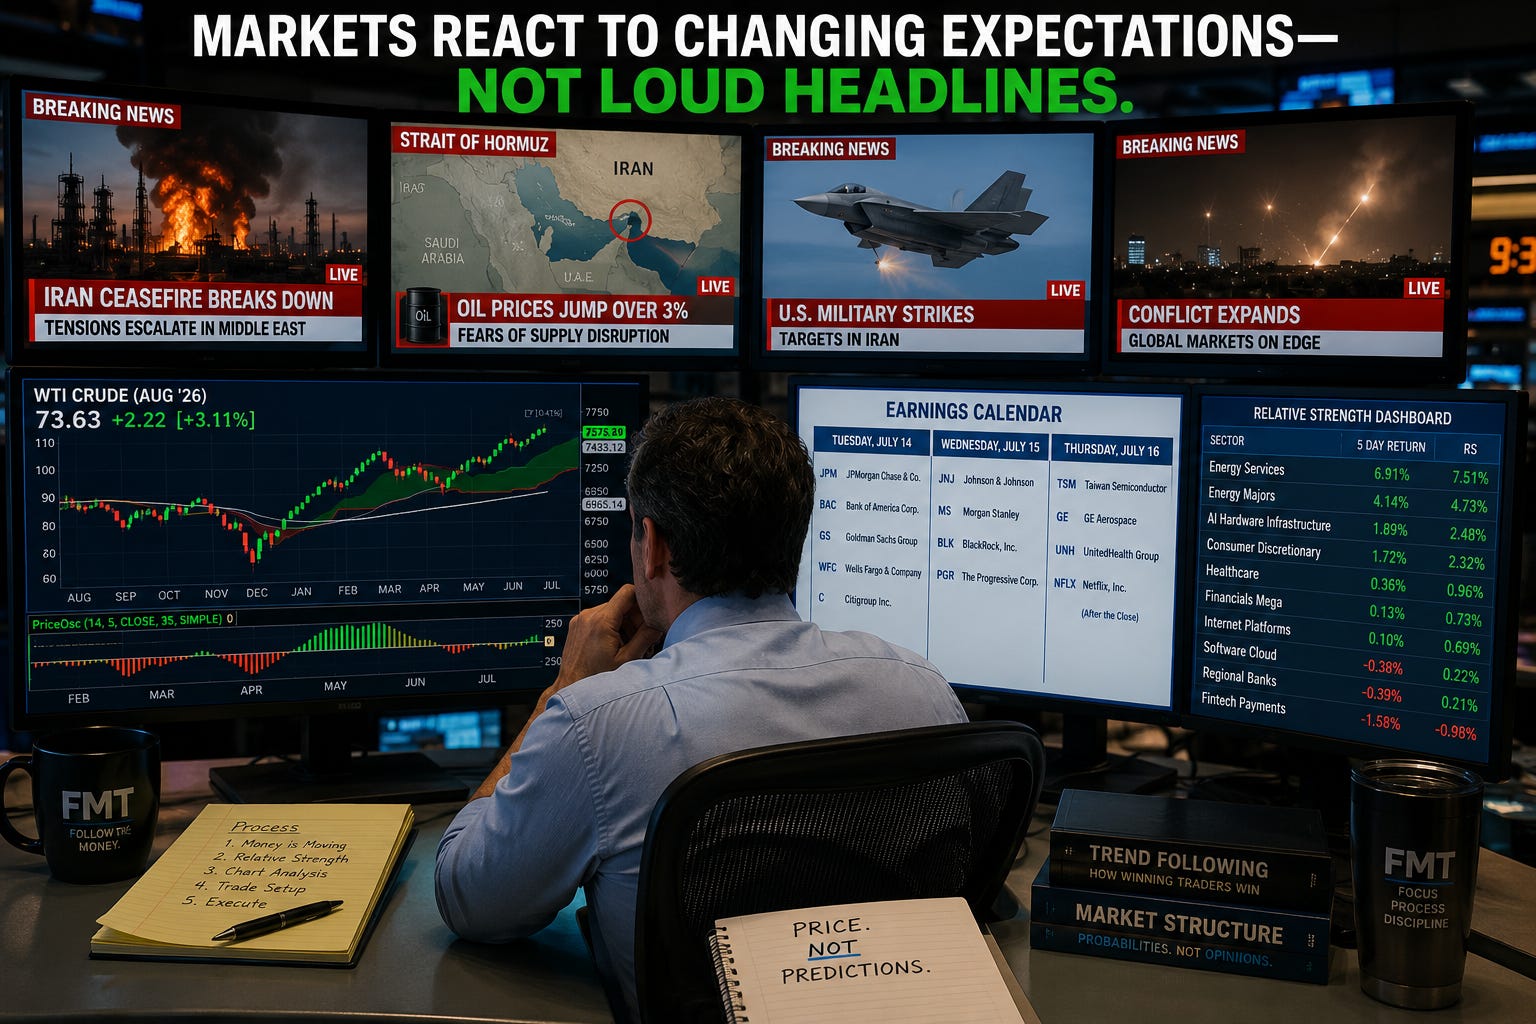
Beyond the Noise – July 12, 2026
Last week we talked about the “Dog Days of Summer.”
The major indexes had rallied sharply off the April lows, momentum had cooled, and the market appeared content to wait for its next meaningful catalyst.
It didn’t have to wait long.
Over the weekend, the fragile ceasefire with Iran unraveled. Military exchanges resumed, the United States became directly involved with targeted strikes, and oil prices immediately jumped more than 3% as traders once again focused on the possibility of disruptions around the Strait of Hormuz.
If you simply watched the news, you might assume investors should be preparing for panic.
Instead...
S&P futures are only modestly lower.
That’s an important reminder.
Markets don’t react to headlines.
They react to how those headlines change expectations.
Oil Is Speaking...
One of the first places investors look during periods of geopolitical uncertainty is the oil market.
This weekend was no exception.
WTI crude climbed back above $73 per barrel after spending much of the past month drifting lower from its spring highs.
At first glance, a 3% move sounds dramatic.
In context, it really isn’t.
Oil remains well below the levels reached earlier this year when geopolitical fears were at their peak. The market is certainly pricing additional risk, but it is not yet pricing a prolonged disruption to global supply.
That distinction matters.
Energy prices influence inflation expectations, transportation costs, corporate profit margins, and ultimately Federal Reserve policy.
If crude continues climbing toward the spring highs, markets may begin reassessing inflation and interest rate expectations.
If oil stabilizes here, investors will likely turn their attention somewhere else.
For now...
Oil deserves watching.
Not fearing.
Earnings Season Takes Center Stage
While the headlines have everyone’s attention, something arguably more important begins this week.
Second-quarter earnings season officially kicks into high gear.
Tuesday brings reports from several of the nation’s largest financial institutions:
JPMorgan Chase
Bank of America
Goldman Sachs
Wells Fargo
Citigroup
Wednesday broadens the picture with:
Johnson & Johnson
Morgan Stanley
BlackRock
Progressive
Thursday adds another round of market-moving names:
Taiwan Semiconductor
GE Aerospace
UnitedHealth
Netflix (after the close)
Banks tell us about lending, consumer health, commercial activity, and credit quality.
Healthcare offers insight into one of the market’s most defensive sectors.
Industrial companies provide clues about manufacturing demand.
Semiconductors continue to reveal whether AI spending remains as strong as investors expect.
For the next several weeks, corporate America—not economists—will largely determine the market narrative.
[Insert Earnings Calendar graphic]
The Trend Hasn’t Changed
Despite the geopolitical headlines, the primary trend remains remarkably intact.
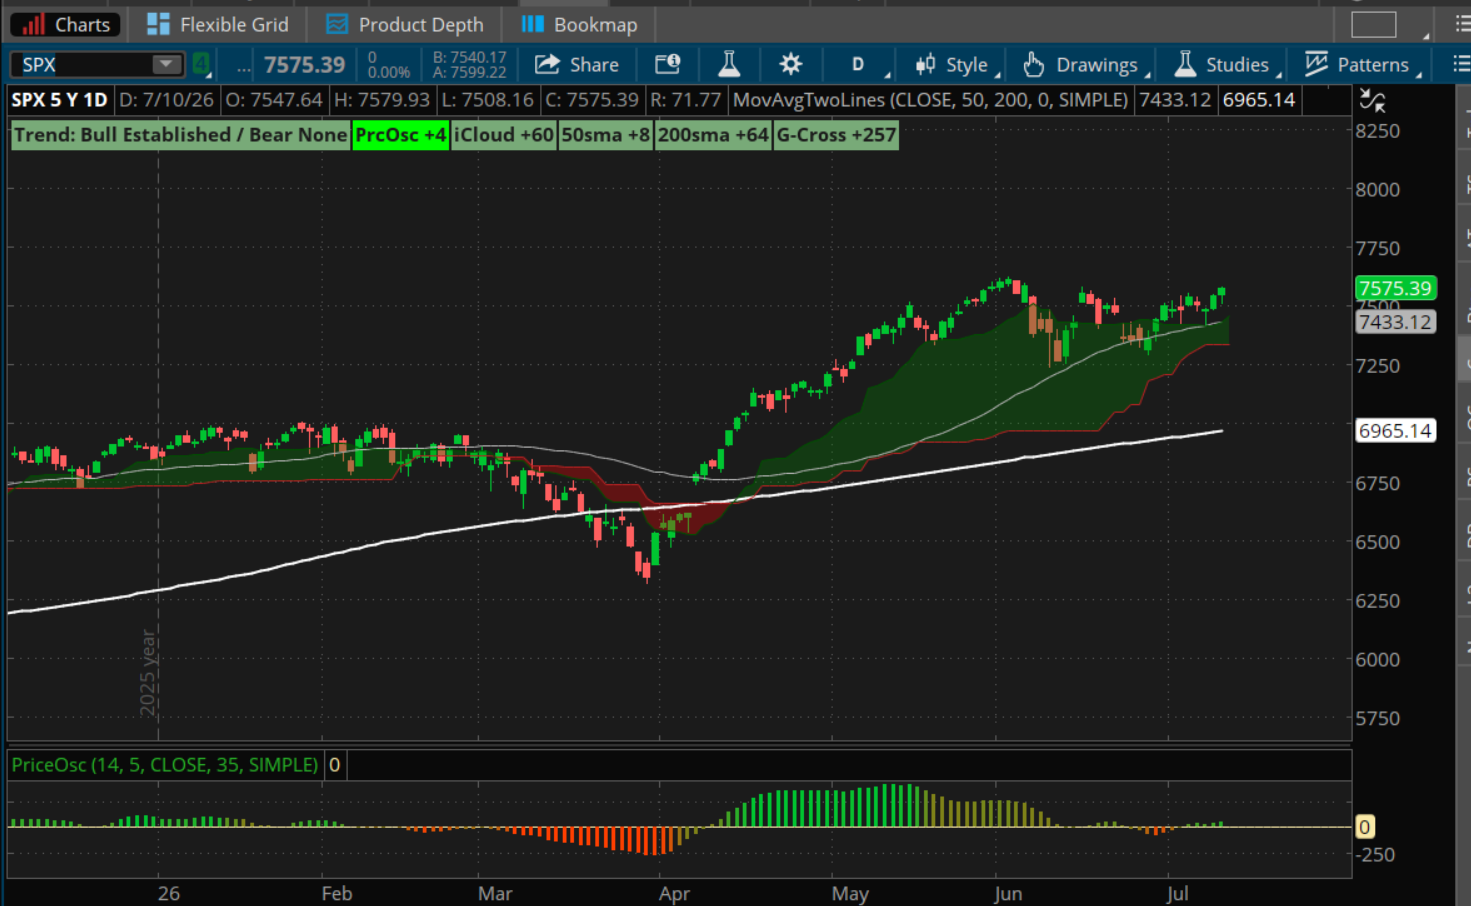
The S&P 500 continues trading above a rising 50-day moving average.
Price remains comfortably above the 200-day moving average.
The Ichimoku Cloud continues supporting the longer-term trend.
Momentum has begun turning higher again after several weeks of consolidation.
Nothing about Friday’s chart suggests investors have abandoned the primary uptrend.
Could that change?
Absolutely.
But successful investing isn’t about predicting what might happen.
It’s about responding to what actually does happen.
One difficult weekend doesn’t automatically erase three months of constructive price action.
Money Is Moving... But That Doesn’t Mean “Buy”
One of the biggest changes we noticed last week wasn’t in the headlines.
It was in sector rotation.
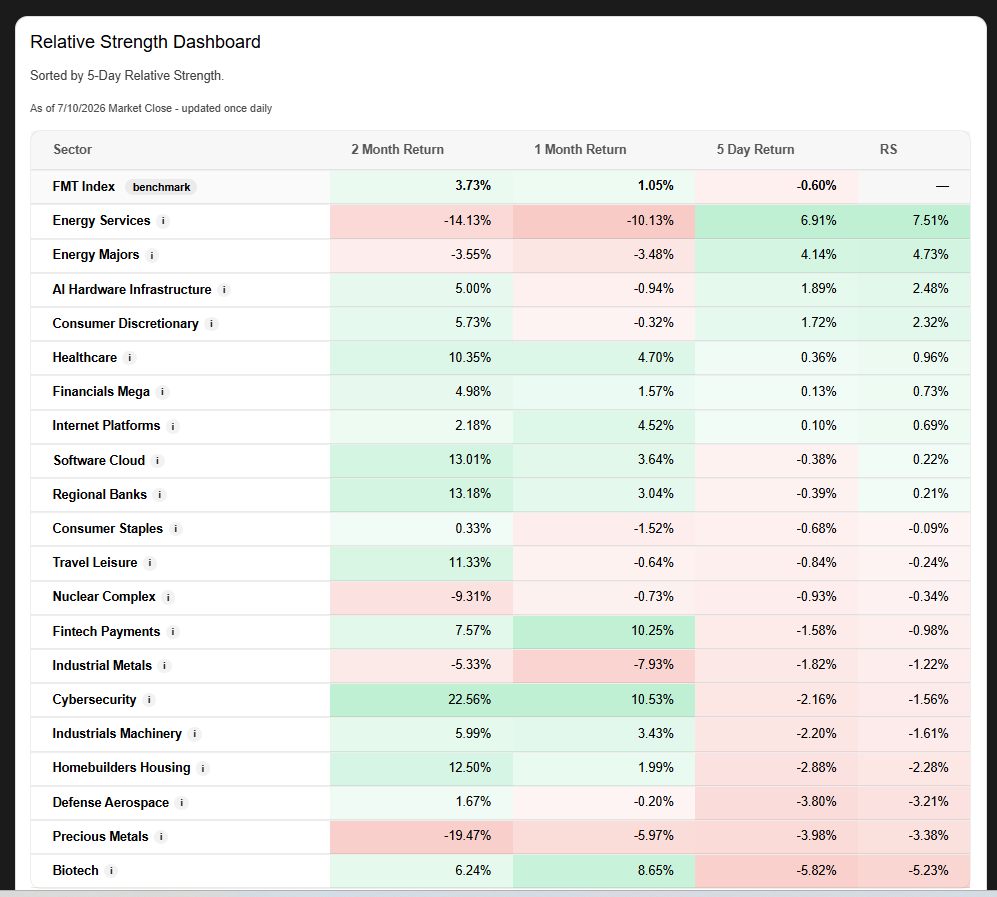
Our Relative Strength Dashboard updates every day, measuring where capital has been flowing over the previous five trading sessions.
One thing I’ve noticed over the years is that many investors misunderstand what relative strength actually tells us.
It’s not a buy signal.
It’s a roadmap.
Over the course of last week, the rankings shifted almost daily as money rotated across sectors. Energy Services climbed to the top as geopolitical tensions resurfaced, but by Friday another familiar group had quietly worked its way back into the top three:
AI Hardware Infrastructure.
If you simply looked at the dashboard, you might conclude:
“Great... time to buy semiconductors again.”
Maybe.
Or maybe not.
Relative Strength tells us where money is flowing.
It doesn’t tell us whether individual stocks already made their move.
That’s where chart analysis comes in.
Relative Strength Starts the Conversation
Let’s look at two of the sector’s biggest leaders.
NVIDIA
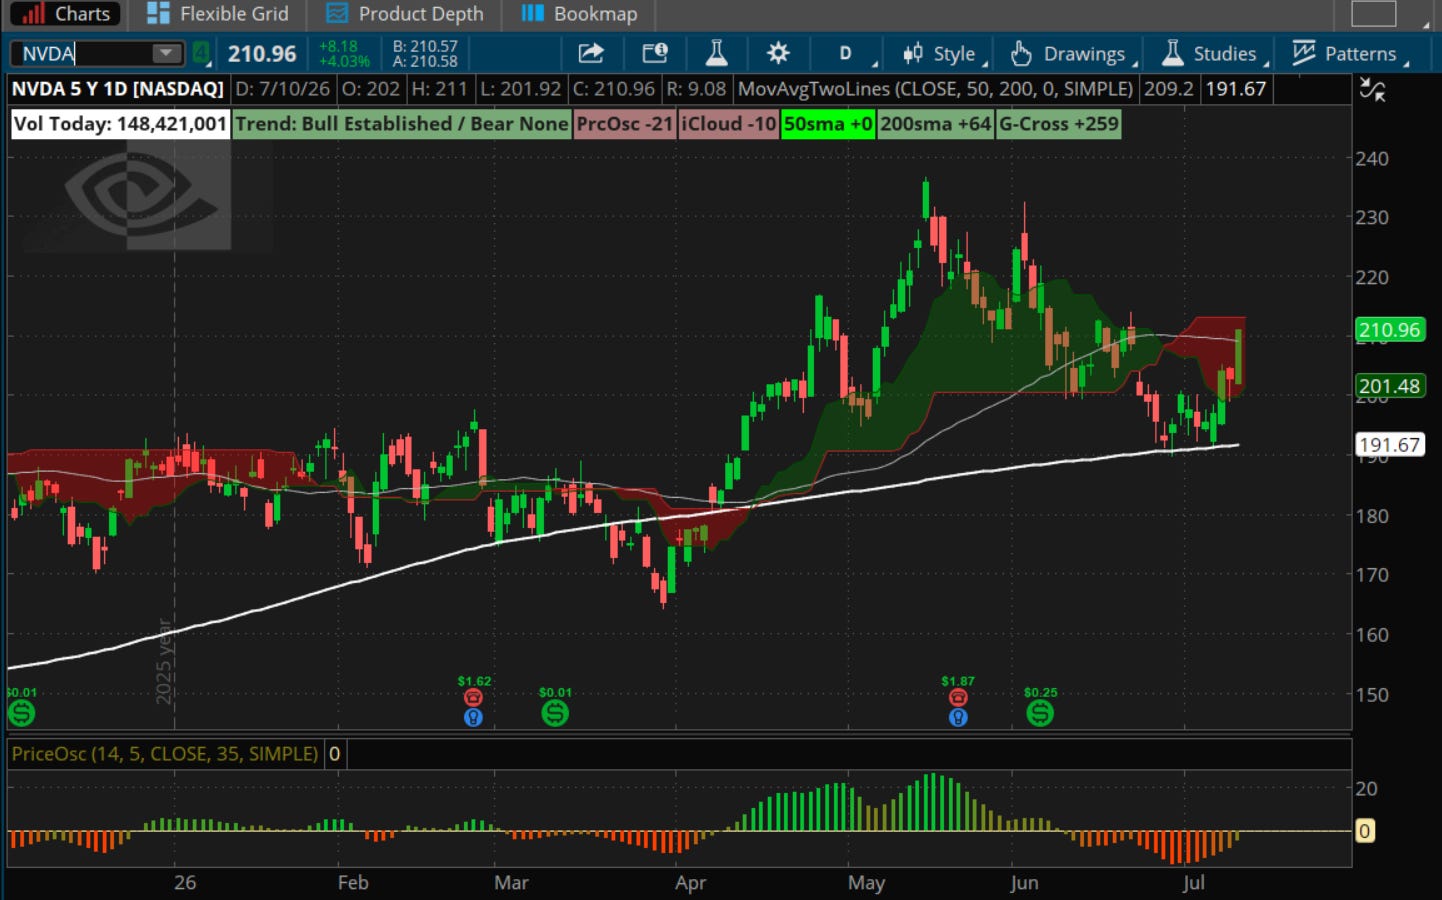
NVIDIA has recovered nicely over the past two weeks.
Price has reclaimed the 50-day moving average while remaining comfortably above the 200-day average, preserving the longer-term uptrend.
That’s constructive.
But notice where price sits today.
After a strong rally from the recent lows, the stock is approaching prior resistance.
Could it continue higher?
Absolutely.
Would we call this a low-risk entry?
Probably not.
Broadcom
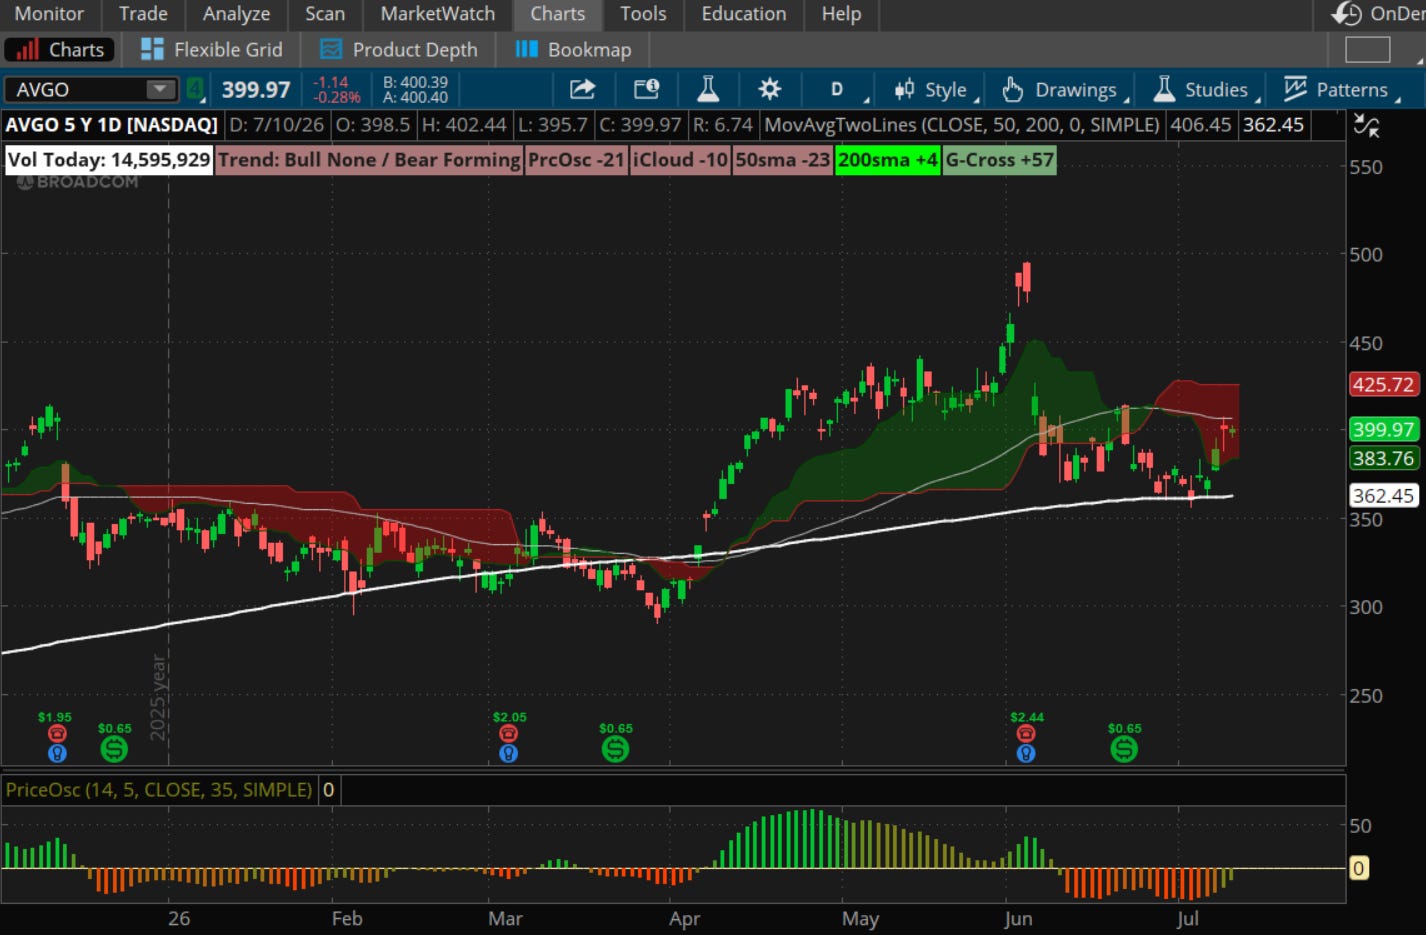
Broadcom tells a similar story.
The longer-term trend remains healthy.
The recent rebound has been impressive.
But price is now pushing back toward the Ichimoku Cloud while still trading below a declining 50-day moving average.
That’s progress.
It isn’t confirmation.
This illustrates an important lesson.
Strong sectors often contain strong companies.
That doesn’t mean every strong company offers a favorable entry today.
This Is Why Process Matters
One of the easiest mistakes investors make is assuming the strongest sector automatically contains the best trades.
Sometimes that’s true.
Often it isn’t.
Relative Strength simply tells us where to begin looking.
From there we ask the questions that actually matter.
Is the trend healthy?
Is price extended?
Is there an attractive reward-to-risk opportunity?
Is momentum improving?
Does the chart agree with the sector?
Sometimes the answer is yes.
Sometimes the answer is “not yet.”
That’s exactly why we’ve built our framework the way we have.
Our Relative Strength Dashboard helps us identify where money is moving.
The chart tells us whether it’s time to act.
Those are two very different questions.
What We’ll Be Watching
This week we’ll be focused on three questions.
Will higher oil prices begin changing inflation expectations?
If crude continues climbing aggressively, it could alter interest rate expectations.
What do the banks tell us about the economy?
Loan growth, credit quality, and consumer spending often provide one of the clearest windows into economic health.
Does the market continue rewarding strong earnings?
Bull markets typically forgive small disappointments while rewarding companies that exceed expectations.
If that behavior continues, the primary trend remains healthy.
Final Thoughts
The headlines this weekend are serious.
They deserve attention.
But successful investing has never been about reacting emotionally to breaking news.
It’s about measuring whether new information changes the probabilities.
So far...
Oil has moved.
Stocks have barely blinked.
Now earnings season begins.
Over the next several weeks, we’ll likely learn far more from corporate conference calls than cable news.
We’ll continue following price, tracking where money is moving, and letting evidence—not emotion—guide our decisions.
Because eventually...
The headlines fade.
The trends remain.
And remember:
Money is moving. Relative Strength tells us where. Price tells us when.